COVID-19 Socioeconomic Vulnerability
Case StudiesThe economic and social repercussions of the novel coronavirus are already becoming evident and are likely to have a tangible, longer-term impact for many Memphians.
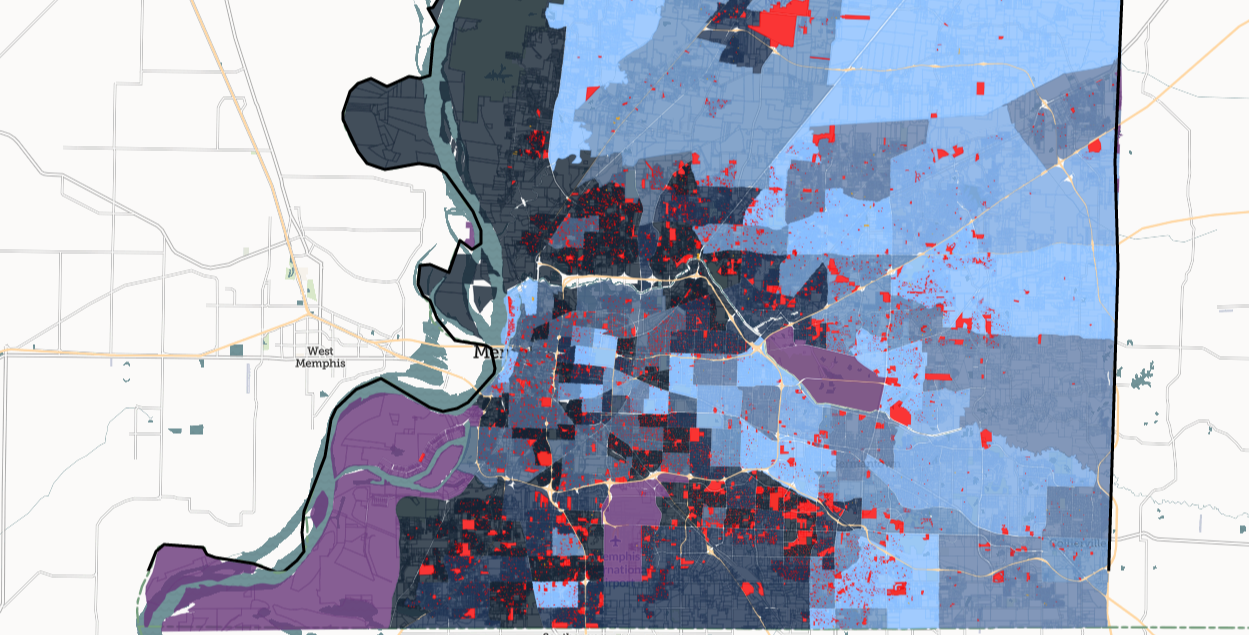
Built from national best practices, our interactive mapping tool takes a data-informed approach to identify the neighborhoods with the highest number of Memphis residents most vulnerable to the ongoing socio-economic impact of COVID-19. Foreclosure notices and eviction filings are also represented in the tool to see the overlap of socioeconomic vulnerability and increasing housing instability.
On reading the map:
- For best results, open in a new window by clicking the button below. The data may take a moment to load, but you should be able to zoom in and out and explore areas of interest quickly.
- All parcels where an eviction filing has taken place over the past 4 years or a foreclosure notice has been issued this year are color-coded in red and orange to contrast with the blues and grays of the index.
- Please note: This map serves as a baseline. We will update the contributing datasets and key findings as things progress.
Key Findings
View the one-pager pdf summary of our key findings
1. Neighborhoods Outside the 240 Loop Most Vulnerable
The following “outside the loop” neighborhoods have both (a) high concentration of socioeconomic vulnerability and (b) history of high eviction rates.
– Frayser
– Raleigh
– Whitehaven
– Hickory Hill
2. Center City’s Predominantly African-American Neighborhoods Vulnerable
The following “inside the loop” neighborhoods have both (a) high concentration of socioeconomic vulnerability and (b) history of moderately concentrated eviction rates.
-South Memphis
-Orange Mound
-North Memphis
-Glenview
-Binghampton
-The Heights
3. Foreclosures are on the rise
– The COVID-19 outbreak began to impact employment in mid-to-late March.
– With foreclosure action requiring 30 days of payment delinquency, the first foreclosures from missed payment were expected mid-to-late April.
– Since April 21st, foreclosures have risen nearly 20%, which could impact both low-to-moderate income homeowners and renters
4. Further Housing Market Destabilization Likely
– The housing market ripple effect from non-payment is expected but may take some time to realize. For perspective, one month where more than 20% of Memphians are unable to pay rent or mortgage could have a $69.43M impact on the local housing economy; the impact after three months is estimated at $208.3M*.
– The first rounds of Federal Stimulus may have helped some low-to-moderate income households pay their bills through May, but with further rounds of relief uncertain, there could be further market disruption for landlords, tenants, and homeowners beginning in June and July.
– Over the last four years of tracking eviction filings in Memphis, there are typically 2500-3000 evictions filed each month. If we see high amounts of nonpayment of rent, this number could grow even higher and that could happen quickly. Innovate Memphis and its partners will continue monitoring foreclosures and evictions in the months to come.
*calculated using 2018 IPUMS ACS Median Housing Cost in Shelby County plus 20% non-payment, which is likely a conservative estimate
Methodology
In the spirit of transparency and collaboration, we are providing our methodology for creating this tool, including any code used to analyze or pull data. We’d like to thank the Urban Institute for their work on creating a Low-Income Job Loss indicator at the tract level using recent unemployment rate data as well as the National Neighborhood Indicators Partnership for their collaborative network of data partners that were vital in creating the methodology for this project.
View our methodology outline for more information on how this tool was created.
Please send any ideas for updates or improvements to the methodology to info@innovatememphis.com.

©2026 Innovate Memphis. All Rights Reserved
Created by eBiz Solutions.